Extreme cold air outbreak 24 years ago

I went through a list of the most extreme cold air outbreaks in the last few decades today, and found this one:

ch4-4
Satellite image from 03:22 on 13 March 1992, downloaded from the Dundee Satellite Receiving Station

It might be just me, but I thought this one was particularly beautiful, with prettym uch the whole Norwegian Sea covered by polar lows. This was the third most extreme such outbreak in the period after 1979, at least according to the ERA-Interim reanalysis.

Polar low north of Svalbard

In a warming Arctic, things have changed and are going to change even more in the future. Check out this polar low north of Svalbard one year ago:

pl_north_of_svalbard

No sea ice north of Svalbard in January is unusual in itself, but a polar low to top it off? That’s pretty amazing.

There’s also a new paper out by Elizaveta Zabolotskikh et al.: New areas of polar lows over the Arctic as a result of the decrease in sea ice extent. The title speaks for itself, and their argument is that “new areas of open water appear where mesocyclones can arise”.

The thing is that polar lows can’t form over sea ice, so when the sea ice retreats, new ocean areas with relatively warm water are exposed to cold air outbreaks, just the environment that is most favourable for polar low formation.

One of the consequences is that the Kara Sea (east of Novaya Zemlya) suddenly also becomes prone to polar lows, and this is bad news because this is along the Northern Sea Route (which allows ships to travel from Asia to Europe way faster than through the Suez Canal).

This winter is not much better in terms of “missing” sea ice. Here’s an image from the National Snow and Ice Data Center in the US:

n_daily_extent_hires

There is little doubt that polar lows can form further north than they usually do, and there is also little doubt that this is a portent of things to come.

Multiple polar lows over the Barents Sea

At least three, maybe even four, polar lows were active over the Barents Sea last night. Here’s a nice satellite image taken early Monday morning:

Uten navn 2
Satellite image downloaded from yr.no

All of these are in the category of cyclones known as “comma clouds”, obviously because they look like inverted commas. As a side-note, maybe they should rather be called “apostrophe clouds”. Anyway, they are what we call baroclinic. That means that the low near the surface is linked to a trough higher up in the atmosphere, and these are not located on top of each other. This vertical structure allows the two lows to work together and to strengthen each other.

For more about this interesting mechanism, check out the Norwegian cyclone model, which was developed by the Bergen school of meteorology.

Most polar lows start out as baroclinic, but many of the develop a warm core and gradually enter a phase where they go from baroclinic to barotropic. Then the lows aloft and near the surface are locked in phase and no longer help each other grow. For the polar low to intensify in this stage, it needs to get its energy from the warm ocean surface.

This is how tropical cyclones (hurricanes) get their energy, too, and some polar lows are in certain ways similar to hurricanes. But so far all the research that has been done on “arctic hurricanes” has shown that the ocean surface is far too cold in the Arctic. In fact, we have a paper in review right now where we look at one such polar low.

Here’s another nice image of the current polar lows:

Uten navn 3
Satellite image taken at 18:27 GMT on 13 December 2015, downloaded from the Dundee satellite receiving station

Polar low brewing outside northern Norway

I just got an alert from the excellent BarentsWatch site about a polar low off the coast of northern Norway. Here’s the latest satellite image (downloaded from yr.no):

1.1

You can clearly see the dual system between Iceland and Norway, and what’s nice about this is that we also see the edge of the cold air outbreak stretching west from the polar lows. Here are some satellite-based wind speeds from about 1600 GMT yesterday, taken from this site:

WMBas78_noaa

This shows nicely how strong the winds are along the edge of the outbreak.

Update: I just found winds from this morning, too, and here wind speeds of more than 50 knots (Force 10 on the Beaufort wind force scale) were estimated by the satellite:

WMBds78_noaa

That’s pretty hefty. We can trace the development back to the disturbance seen in this picture from Wednesday, a few hours before the wind snapshot above:

1.1-2

It’s moving slowly, but seems to have built some strength since yesterday.

First polar low of 2015/16 season

Our good friend at the Norwegian Met Office in Tromsø, Gunnar Noer, just told me that they observed the first polar low (with an impact on Norway) this season a few days ago. Here’s a satellite image taken at 18:21 on 26 October 2015:

pl1

The polar low is clearly visible just north of northern Norway. At 20:00 UTC the polar low is more developed:

pl2

It’s also clear that the polar low formed in a cold air outbreak well north of the well polar front (the region that separates cold air in the north from warm air in the south), which is one of the main characteristics of polar lows.

I also found an image of satellite-derived surface wind speeds from the ASCAR radar (click image for higher resolution):

pl_ascat_cropped

This shows that the polar low produced fairly strong winds. There’s plenty of other interesting features as well (as in pretty much every satellite image):

  • A jet along the sea ice edge just north of Iceland, probably due to the high mountains of Greenland. It’s more common to get jets in northerly flow in this region.
  • The left-side jet off the northern tip of Novaya Zemlya, also due to topography. Left-side jets are normally stronger than right-side jets because flow towards a barrier creates a small-scale high pressure anomaly in front of the barrier, and this strengthens the jet.
  • The strong southerly flow along the coast north of southern Norway, also a left-side jet.
  • The strong winds along the polar front, which isn’t unusual in any way.

Polar lows for Christmas

At the end of last year, a cold air outbreak over the Nordic Seas spawned a couple of nice polar lows. This picture was taken on Christmas Day:

xmaspl

The cold air outbreak reached down to Iceland, but there was a boundary-layer cold front, or what we would call an Arctic front, just north of 70 degrees north. These fronts can be nasty in themselves, with strong surface wind speeds and lots of snow, and they also breed polar lows. In the picture above there were two such lows. The only one that developed further, though, was the one on the right.

Here’s a picture taken about 36 hours later:

xmaspl2

By this time the eastern part of the Arctic front has moved south, while the polar low stayed put. The white clouds indicate deep convection, meaning that it had developed tall clouds and probably lots of precipitation. The official meteorological station in Tromsø got 35 mm of snow during 25 and 26 December. Arctic fronts are much more shallow, as testified by the clouds along the one in the picture, but they can easily produce thunderstorms and heavy snow.

Labrador Sea Polar Low in Extreme Detail

We received the following e-mail from Prof. Kent Moore at the University of Toronto:

NASA today published a striking image of cloud streets over the Lab Sea. […] The low that was causing the trouble in Iceland can be seen up along the SE coast of Greenland. The flow distortion traced out by the clouds is striking as is the nascent polar low. You can see a slight ‘kink’ in the sea-leve pressure field from the ECMWF analysis.

This is a thumbnail of the NASA image (click for more detail) and click here for the NASA page with even higher resolution:

image04062014_1km

This is the ECMWF analysis, where you can see the trough off the coast of Labrador:

ec


Polar low in massive cold air outbreak

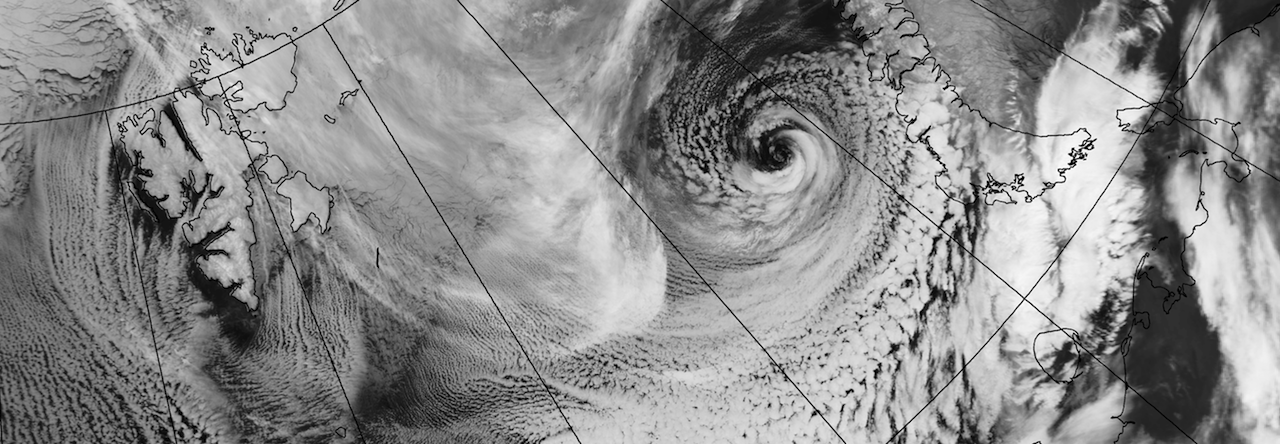
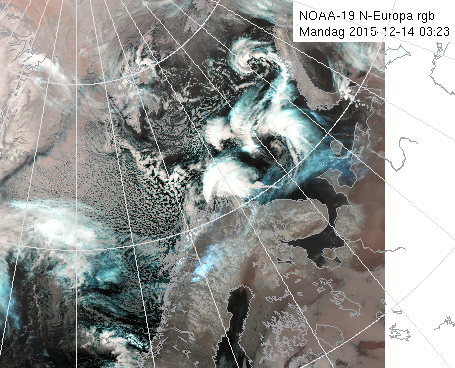
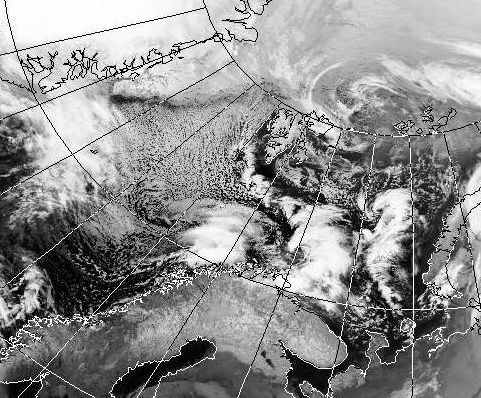
This picture was taken just before noon on Friday 6 December 2013 (courtesy of the Dundee Satellite Receiving Station):

pl_2013-12-06

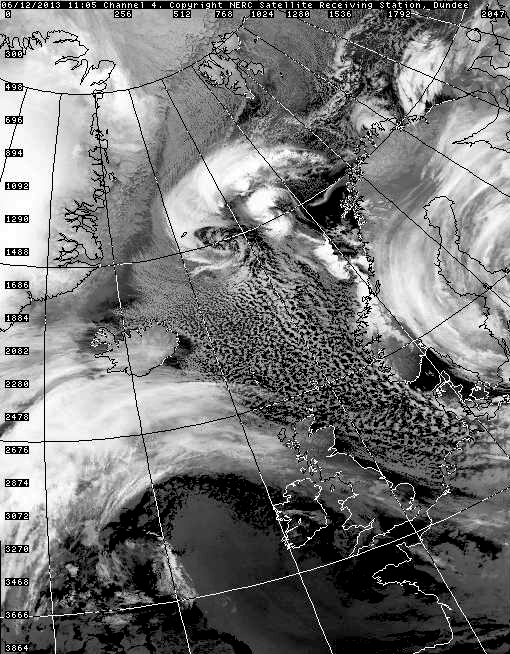
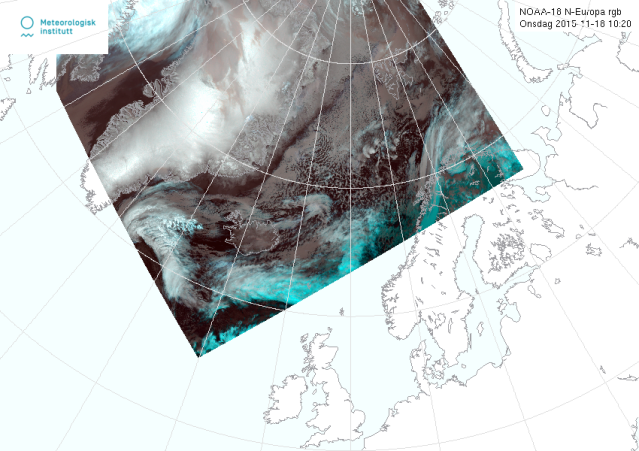
There is little reason to doubt that that’s a polar low up at 70 degrees north. It moves towards the south inside a cold air outbreak that covers much of the North Atlantic north of the British Isles.

There have been strong winds here in Bergen (at 60N on the west coast of Norway) ever since yesterday, when a strong low moved in from the west. The cold air outbreak is due to the northerly winds in the wake of that low. Check out the supply ships in the harbour of Bergen earlier today:

bilde

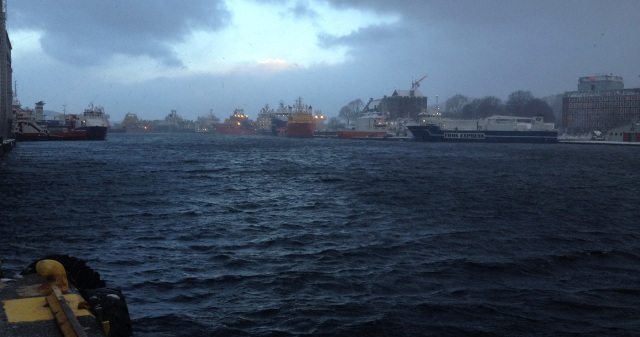
They have nowhere to go right now. The winds are fierce, there is a storm surge, and last night we had about 10 inches of snow. Pretty chaotic, in other words.

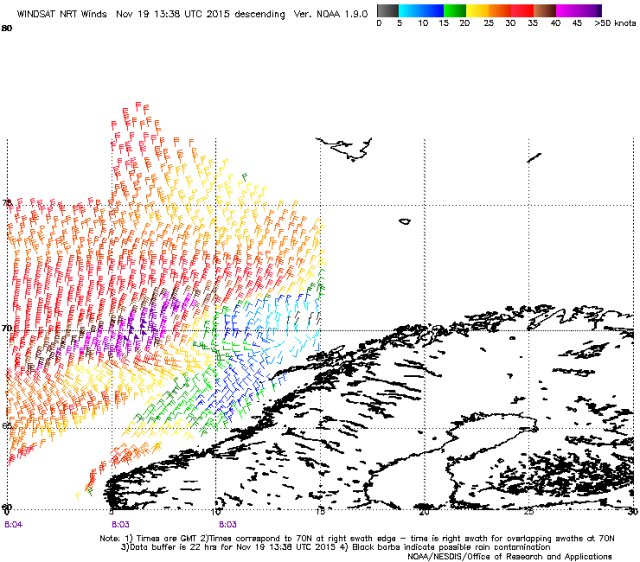
As for the polar low heading south, it’s a big one. This is an ECMWF wind speed forecast for later today (2100 GMT):

diana

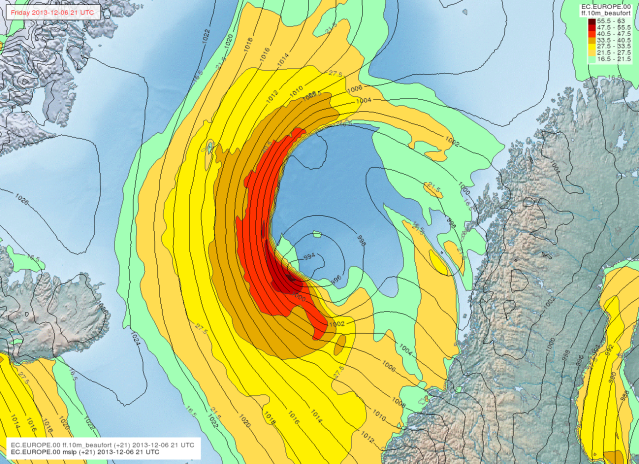
The wind speed is shown with colours in knots. On the Beaufort  scale, the lightest one of the two red colours is strong gale and the darkest one is storm. The tiny black speck is violent storm, just one step below hurricane force. Now wonder those ships are staying put in Bergen.

For the weather nerds, note that the air pressure in the polar low is quite high compared to other storms. The strong winds are due to the gradients between the polar low and the ridge over Greenland.  In addition, the  low is moving southwards, so that adds to the strong southerly winds near the core of the low.

Also note the extreme wind speed gradients. It is all but calm to the north-east of the low. This is another reason that polar lows are dangerous, the insane local variations, from violent storm to nothing in just a few tens of kilometers.

As for the path of the polar low, it looks like it’s going to die before it hits land. By early Saturday morning it will be over.

Cold air outbreak in amazing detail

The current cold air outbreak, the first proper one this winter (see previous post), reveals incredible small-scale structure in the satellite image below. The land in the upper middle part of the picture is the Svalbard archipelago in the Northeast Atlantic.Image

The resolution of the original image (which you can see by clicking on the image above or go here) is 500 metres, which means that each pixel in the image is 500 metres wide. For maximum detail, check out this image at a resolution of 250 metres. There are so many things to see in the image, but here are some of the highlights.

In the upper left part of the picture, the white tendril-like features are sea ice. We also see some large floes. It’s all being blown southwards and at the same time broken up by the strong surface winds.

The north-south-oriented stripes that are made up of individual white dots are what we call cloud streets. They only occur when there’s a lot of convection (rising air) going on, and the dots themselves are cumulus clouds. Further south, away from the sea ice edge, the convection becomes less intense, and the cumulus clouds merge together into large patches of stratocumulus clouds. Cloud streets are a tell-tale sign of strong surface winds.

Downstream from Svalbard and in the lower part of the picture, the clouds get organized into a vortex. This is because there’s a small low-pressure system there, and the air starts to move in spiral-like, anti-clockwise patterns around the low (because of the earth’s rotation and the Coriolis force). The beautiful pattern we see in the image is, in other words, a polar low. Not a big one, but a polar low nonetheless.

Another interesting thing in the image are the wave clouds over and downstream from Svalbard. They form because the air moves over the mountains, much in the same way that waves form when water in a river hits rocks.

If you want to see more images from this region, take a look at NASA’s Hornsund subset.

First polar low this season

The satellite image on the left shows what I think must be the first polar low in the Northeast Atlantic this winter. At least it’s the first time snow is forecast for large parts of Norway, a sure sign that there’s a cold air outbreak in its way. The cold air outbreak itself is also clearly visible in the image, with its patchy or dotty structure. These are clouds that are organized into what we call “convective cells”.

A satellite image of the Northeast Atlantic, taken at 0940 on 23 October 2012. Downloaded from the Dundee Satellite Receiving Station in Scotland.

Convection is the meteorological term for rising air, and rising air is what creates all kinds of clouds. The convective cells in the picture are cumulus clouds which are formed because the cold air is heated from below by the (relatively) warm ocean surface, much the same as what happens when you blow on a bowl of hot soup. When air is heated, it gets lighter, and therefore it rises, letting colder air flow in from all sides to replace it.

So, the cold air outbreak in the picture sets up a lot of rising motion in the air masses. At the same time, there’s evaporation going on so that the air gets humid. And when humid air rises fast to create cumulus clouds, you get precipitation, in this case in the form of massive snow amounts forecast for Norway. Along the coast, people are going to witness tall cumulus and cumulonimbus clouds marching past them on their way south. Cold air outbreaks don’t always come as far south as Bergen, but I sometimes see these majestic clouds trotting along. It’s a very nice spectacle.